
After a week of intense micro-seismic activity in the wider area of the Kīlauea volcano in Hawaii, suddenly last Thursday a volcanic crack appeared near the road network, from which lava and hot steam appeared (Figure 1). The Civil Protection instructed residents of the Puna community (~ 10,000) to leave their homes immediately. On Friday, May 4, 2018, a powerful 6.9 earthquake hit the Big Island, the largest in the past 43 years.
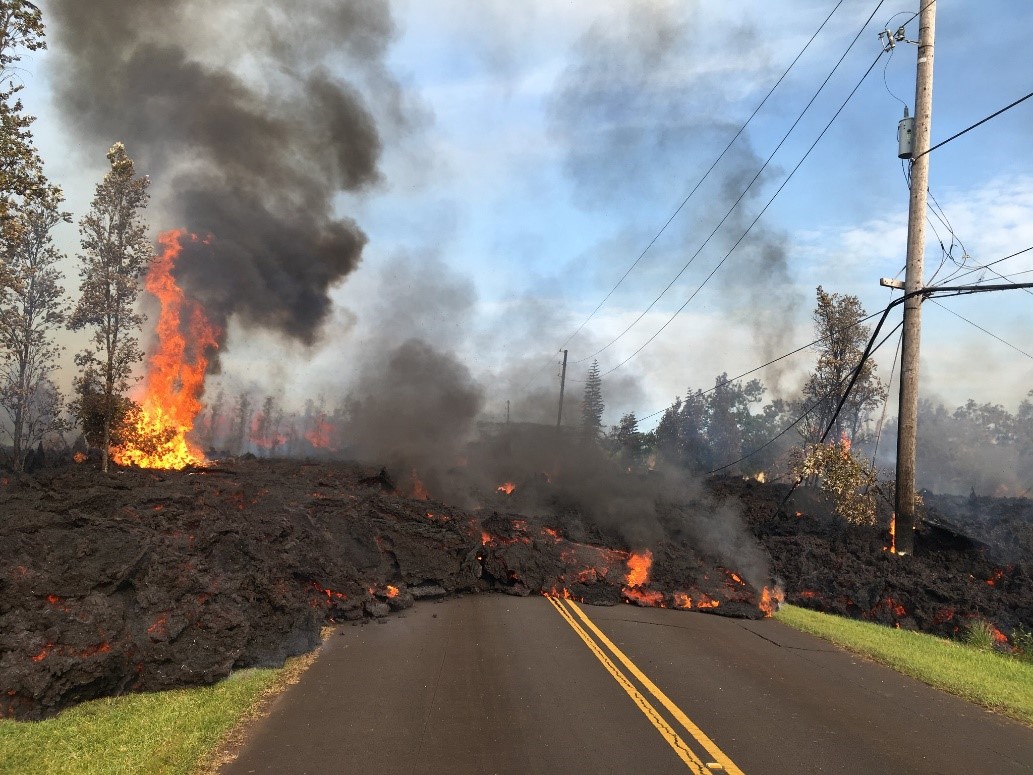
Figure 1. Field photos acquired on 5th of May 2018: lava from fissure 7 slowly advanced to the northeast on Hookapu Street
The team of the BEYOND Center of Excellence of the National Observatory of Athens (NOA) responded immediately and activated the GeoHub service. GeoHub service is a fully automated Sentinel satellite data processing application that estimates the spatial deformation due to geophysical processes.
In the case of the ongoing activity in the Kīlauea Volcano, GeoHub was linked with the Greek Sentinel Mirror Site (https://sentinels.space.noa.gr/) and downloaded a time series of Sentinel-1 radar images. The powerful BEYOND/NOA servers, within minutes after receiving the appropriate Sentinel-1 satellite imagery, processed this data set using radar differential interferometry techniques, and promptly delivered to the international scientific community constantly updated information on the evolution of the regional deformation.
Figure 2 shows the resulting interferograms that correspond to the ground deformation patterns for 2 cases: the first one covers only the period of the volcanic eruption that began on Thursday, while the second covers both the period of the volcanic eruption and the effect of Friday’s large earthquake on. Each interferometric fringe, these contour-like curves appearing on the interferograms, correspond to approximately 2.8 cm vertical displacement of the ground.
There is intense subsidence at the top of the volcano as magma material moves along the East Rift Zone and escapes to the eastern edge of the fault. The maximum deformation along this zone, located between the top of the volcano and the area where the lava was observed on Thursday, is approximately 60-70 cm. This information is extremely useful for both the scientific community and the local authorities responsible for evacuating the area and taking measures to protect peoples’ lives and their property.
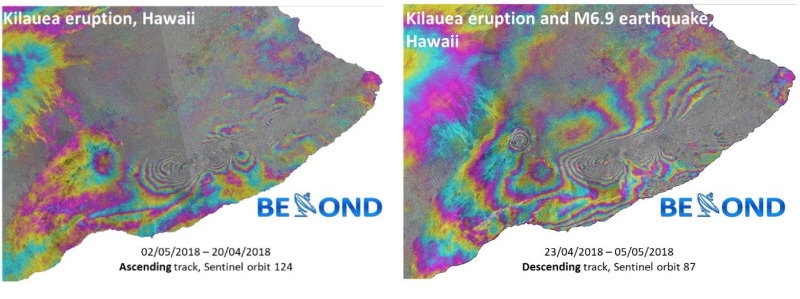
Figure 2. Interferograms depicting ground deformation assuming (left) the impact of Thursday’s volcanic activity, and (right) the combined effect of Thursday’s volcanic activity and Friday’s M6.9 earthquake.
The phenomenon is in progress and BEYOND/NOA's GeoHub team seamlessly receives and processes Sentinel satellite data to provide frequent information updates to the community.