![]() Click the ClimaHub Button to visit Data Extraction Application for Regional Climate
Click the ClimaHub Button to visit Data Extraction Application for Regional Climate
Reliable, user friendly and open access data of present and future climate state from high resolution Regional Climate Models (RCM) is essential to support decision makers, stakeholders, intermediary users and end-users for climate change impacts, mitigation and adaptation. Thus in the framework of the GEO-CRADLE project, we have developed The Data Extraction Application for Regional Climate (DEAR-Clima), which is a user friendly interactive web application tool that visualizes and provides time series of Essential Climate Variables and Climate Indices.
MAIN OBJECTIVES & OUTCOMES
The main objectives of DEAR-Clima web application tool is to process, visualize and provide reliable climate information for the region of Europe, Mediterranean and North Africa in a simple format that can be used by the climate experts and the average users alike. The development of this web application tool aligns itself with the coordination and integration of state-of-the-art Earth Observation activities in the regions of North Africa, Middle East, and Balkans and create links with GEO related initiatives towards GEOSS.
RELATED SERVICES & PLATFORMS
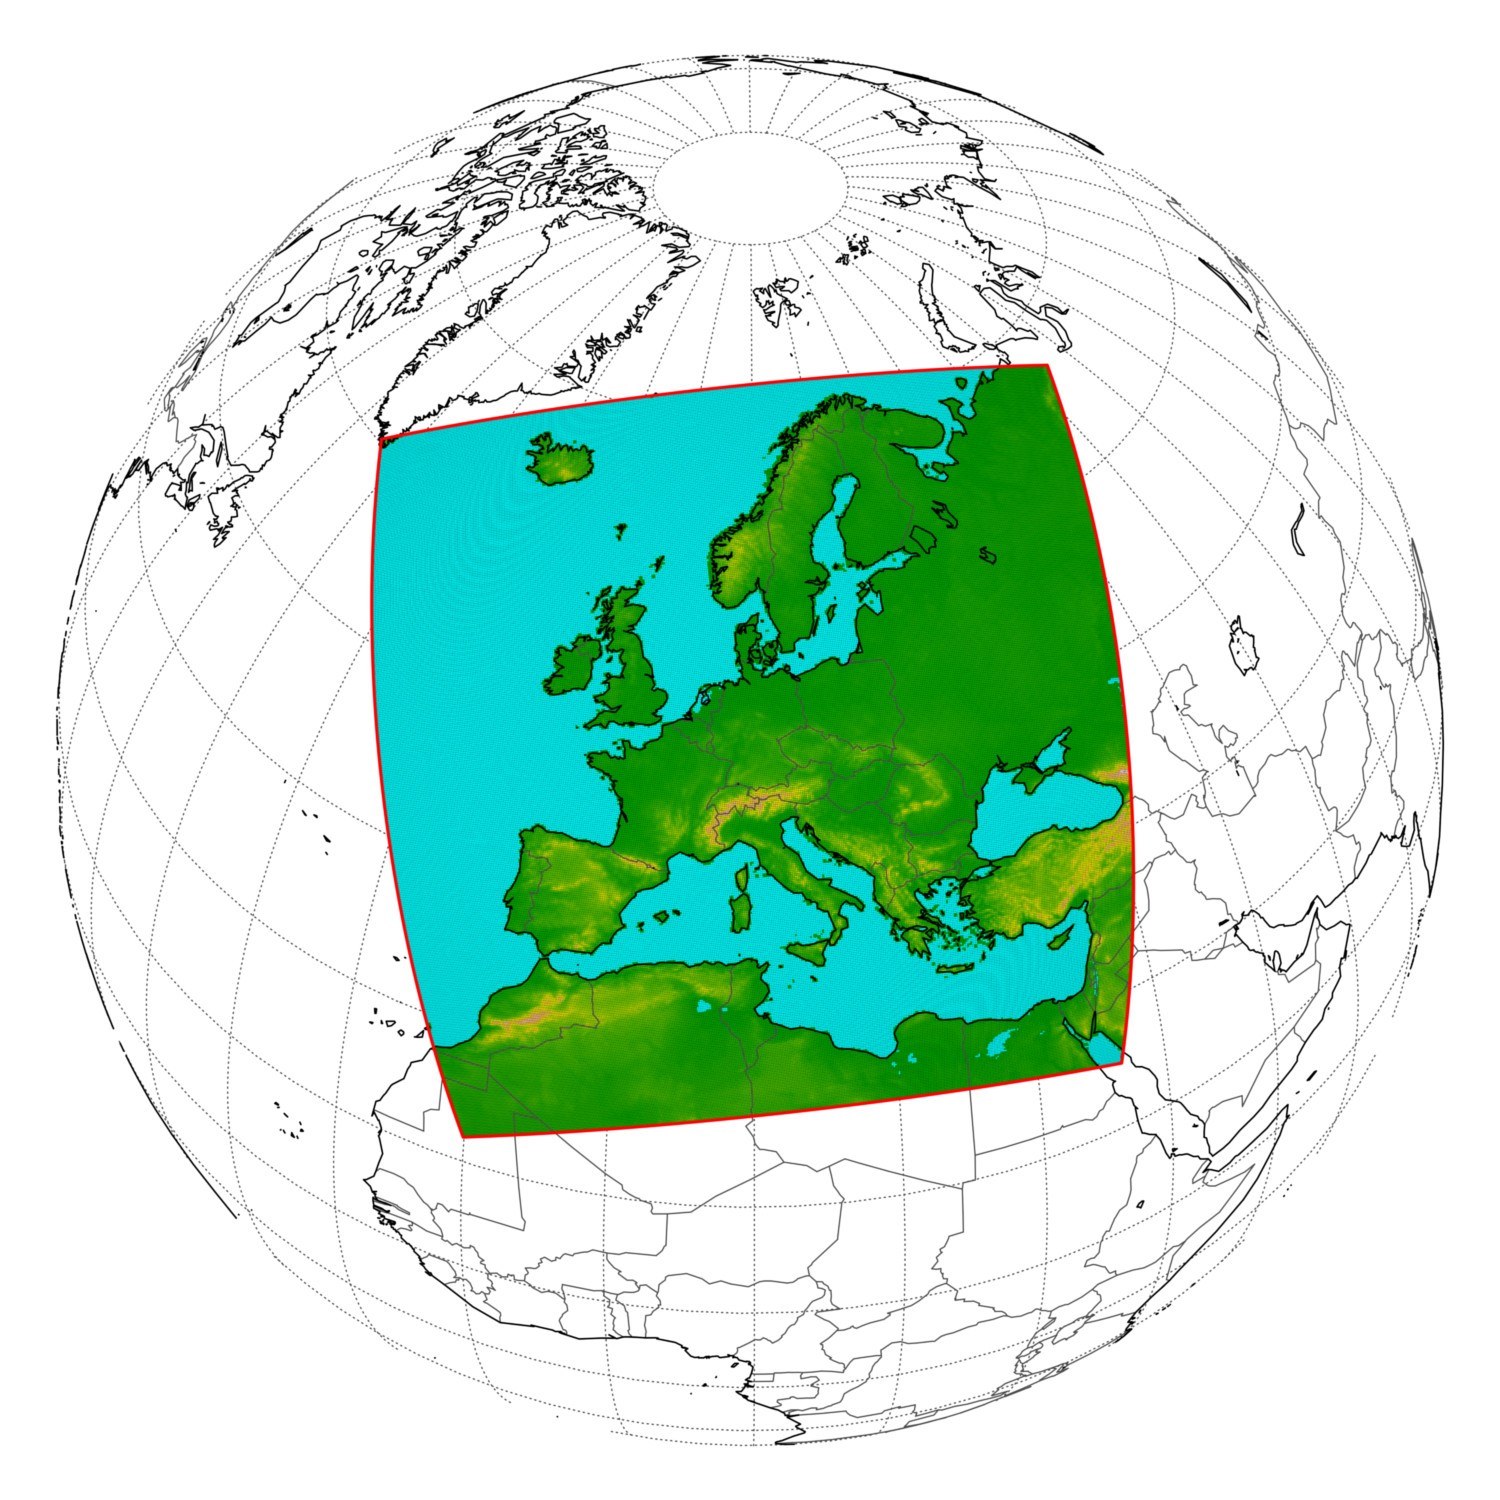
DEAR-Clima is based on high horizontal resolution Regional Climate Model (RCM) simulations from the Coordinated Regional Downscaling Experiment (CORDEX) research program. The simulation experiments are a product of various RCMs driven by several Global Climate Models (GCMs). The RCM data processed in this web application tool have a high spatial resolution (0.11°) that covers the EURO-CORDEX domain.

Figure 1.The EURO-CORDEX domain
The simulations cover a period from 1950 to 2100. The historical period of each experiment refers to the period 1950-2004, while the future period is 2006-2100 under the influence of three Representative Concentration Pathways (RCPs) adopted by the IPCC for its fifth Assessment Report (AR5); rcp26, rcp45 and rcp85. The RCP2.6 represents a low end representative concentration pathway scenario which aims to limit the increase of global mean temperature to 2°C by the end of the 21st century. The RCP4.5 sets as a goal the stabilization of the global radiative forcing at 4.5 W·m -2 (equivalent to 650ppm CO2) without ever exceeding that value until the year 2100. The RCP8.5 assumes a future with high global population, lack of environmental and climate change policies, relative low financial prosperity combined with a moderate pace of technological advancements that does not resolve energy requirement efficiently.
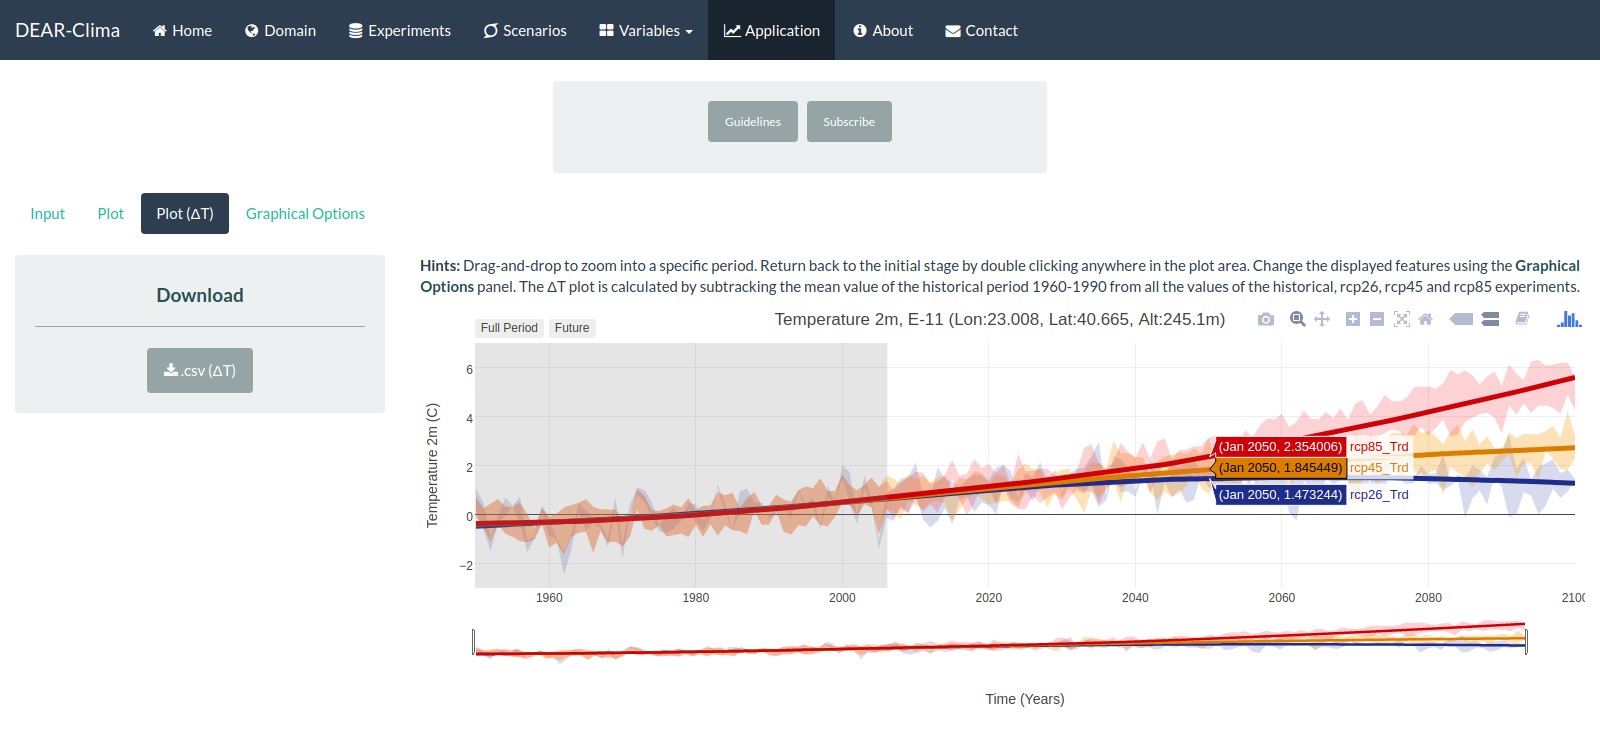
The visualization and extraction of climate information can be obtained in three simple steps. (1) Initially the user can select the desired temporal resolution (yearly, monthly and daily basis) and an Essential Climate Variable or a Climate Index. If the user selects the monthly or the daily temporal resolution, he is prompt to select also a combination of a specific RCM and GCM experiment. (2) Afterwards the user can select a specific location either by entering the extract Longitude and Latitude or by selecting a specific grid cell on an interactive map. (3) The final step is to submit your request and wait until the processing is completed. The user can then alter the graphical options of the plots and can download the climate data timeseries in an ASCII format.

Figure 2. An example of DEAR-Clima climate timeseries visualization
CONTACT PERSON
Athanasios Tsikerdekis, This email address is being protected from spambots. You need JavaScript enabled to view it.
Dimitris Akritidis, This email address is being protected from spambots. You need JavaScript enabled to view it.
Prodromos Zanis, This email address is being protected from spambots. You need JavaScript enabled to view it.

